COVID-19 Cases In Orange County, CA
Collect daily number of cases and output to a chart
About this project

UPDATE: June 26, 2020
The Orange County Health Care Agency changed their user interface in which they report the number of cases for each city amongest other changes. It is much more modern with more types of insight. One of the nice additions is the reporting of zip-codes that contain the accumulated number of cases in the county. Unfortunately, this new Website still does not provide a history of number of cases for zip-codes or city. I have refactored my code capture the new layout for daily cases in the city as well as the new zip-code data.

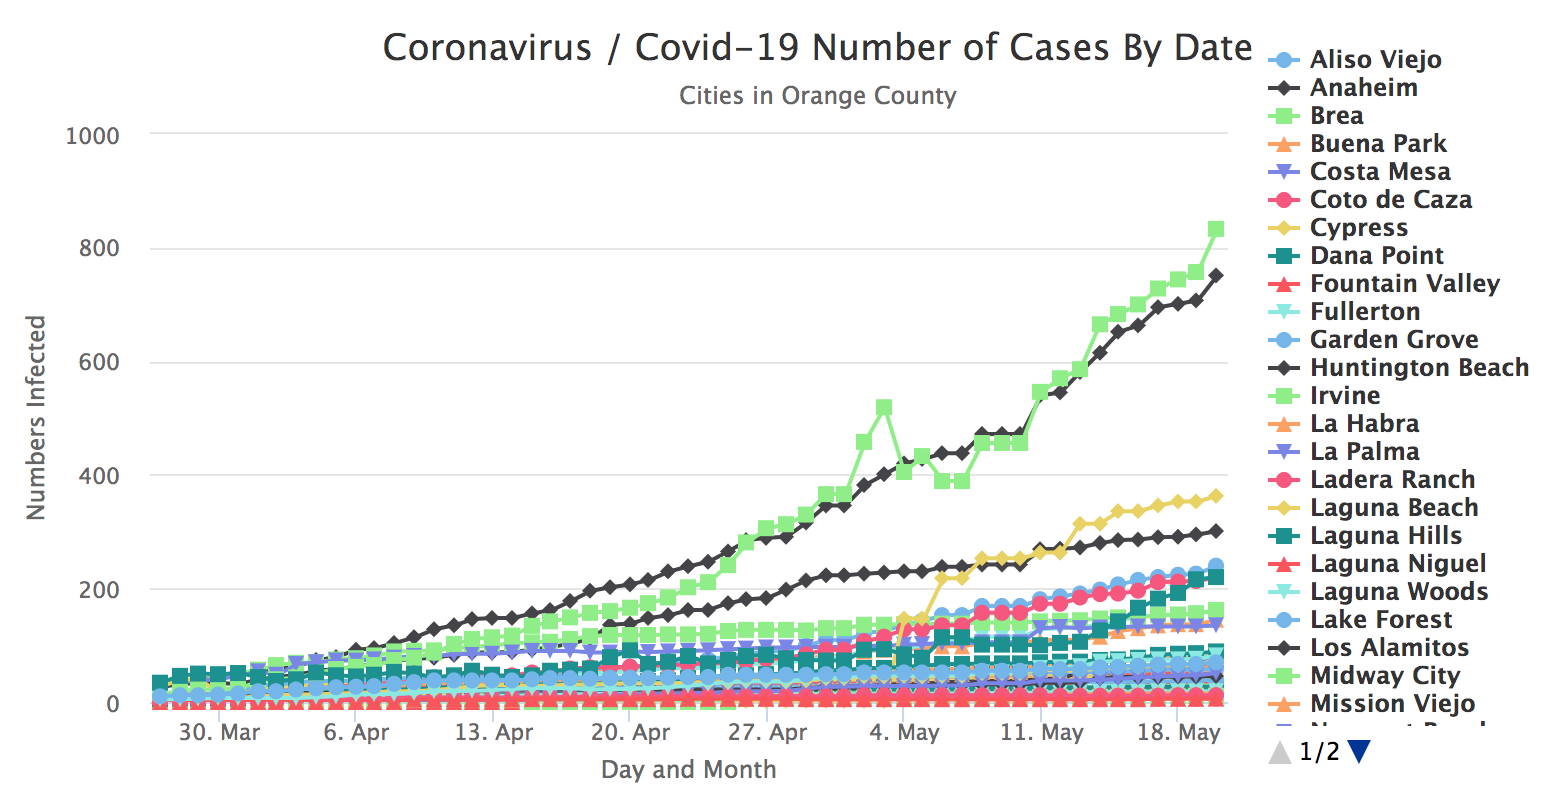
I have a backlog of COVID-19 data I kept track of since late March 2020. This data was manually pulled from a reliable source which contained the numbers of infected from the coronavirus by city in Orange County, California. Initially, I manually created charts from a spreadsheet and sent these charts to my friends and family on a regular basis. The data source only reported the total number of cases each day. This is unfortunate because it doesn't show the rate of growth in any way.

Months later, I was introduced to Highcharts and decided to look up the service. As anyone would expect of me, I decided to test Highcharts and saw that although relatively simple it is to use Highcharts, it was very powerful.

I decided to create essentially two applications. First, collect daily data from a source and append this new data to the data I already had. Second, create a User Interface to connect to this data and output a chart using Highcharts. Since this is now available to the world, anyone can visit this Website and see the chart, updated automatically at 6 PM Pacific Time.

Architecture

There are two main parts to this application.

The first part is the client-side which provides the User Interface using Highcharts to display the chart. There is an AJAX call to a JSON file which holds key value pairs for each city reported along with an array as the value for the cumultive numbers of affected.

The second part is the server-side using Python to convert the manual data in CSV I've collected to JSON format and tossed this file on AWS S3.

Next, I created a Python script to obtain this JSON file and store it in memory so that I can append new data to. Using Selenium, I was able to scrape the new updated cases for each city and append it to the data I have in memory before uploading it back to AWS S3.

I wrapped Python scripts in a AWS Lambda function and configured it to run at 6 PM Pacific Time every day.

The most interesting and learning experience was two fold. One, was that I learned one cannot save/modify OS files within the AWS Lambda function, which is the reason I had to load the JSON file in memory, add new data and reupload to AWS S3.

Two, was that Highcharts required the data in a particular format. This format required an array of key/value pairs with "name" as one of the keys. Since I have raw data in JSON format, I didn't want to mess with it and came up with a solution to load the JSON file on the client-side and recreate an array of objects that satisfies the requirement.

Technologies
  • Python
  • Highcharts
  • Selenium
  • JavaScript
  • HTML5
  • CSS3
  • AJAX
  • AWS Lambda